Security of Information, Threat Intelligence, Hacking, Offensive Security, Pentest, Open Source, Hackers Tools, Leaks, Pr1v8, Premium Courses Free, etc

  • Penetration Testing Distribution - BackBox

    BackBox is a penetration test and security assessment oriented Ubuntu-based Linux distribution providing a network and informatic systems analysis toolkit. It includes a complete set of tools required for ethical hacking and security testing...
  • Pentest Distro Linux - Weakerth4n

    Weakerth4n is a penetration testing distribution which is built from Debian Squeeze.For the desktop environment it uses Fluxbox...
  • The Amnesic Incognito Live System - Tails

    Tails is a live system that aims to preserve your privacy and anonymity. It helps you to use the Internet anonymously and circumvent censorship...
  • Penetration Testing Distribution - BlackArch

    BlackArch is a penetration testing distribution based on Arch Linux that provides a large amount of cyber security tools. It is an open-source distro created specially for penetration testers and security researchers...
  • The Best Penetration Testing Distribution - Kali Linux

    Kali Linux is a Debian-based distribution for digital forensics and penetration testing, developed and maintained by Offensive Security. Mati Aharoni and Devon Kearns rewrote BackTrack...
  • Friendly OS designed for Pentesting - ParrotOS

    Parrot Security OS is a cloud friendly operating system designed for Pentesting, Computer Forensic, Reverse engineering, Hacking, Cloud pentesting...
Showing posts with label Engenharia Reversa. Show all posts

Sunday, July 8, 2018

Diggy - Extract Enpoints From APK Files


Diggy can extract endpoints/URLs from apk files. It saves the result into a txt file for further processing.


Dependencies
  • apktool

Usage
./diggy.sh /path/to/apk/file.apk
You can also install it for easier access by running install.sh
After that, you will be able to run Diggy as follows:
diggy /path/to/apk/file.apk


Share:

Saturday, October 7, 2017

An Interactive Disassembler for x86/ARM/MIPS - Plasma


PLASMA is an interactive disassembler. It can generate a more readable assembly (pseudo code) with colored syntax. You can write scripts with the available Python api (see an example below). The project is still in big development.

wiki : TODO list and some documentation.

It supports :
  • architectures : x86{64}, ARM, MIPS{64} (partially for ARM and MIPS)
  • formats : ELF, PE, RAW
Warning: until structures and type definitions are not implemented, the database compatibility could be broken.

Requirements
Optional :
  • python-qt4 used for the memory map
  • keystone for the script asm.py

Installation
./install.sh
Or if you have already installed requirements with the previous command :
./install.sh --update
Check tests :
make
....................................................................................
84/84 tests passed successfully in 2.777975s
analyzer tests...
...

Pseudo-decompilation of functions
$ plasma -i tests/server.bin
>> v main
# you can press tab to show the pseudo decompilation
# | to split the window
# See the command help for all shortcuts

Qt memory map (memmap)
The image is actually static.

Scripting (Python API)
See more on the wiki for the API.
Some examples (these scripts are placed in plasma/scripts) :
$ plasma -i FILE
plasma> py !strings.py             # print all strings
plasma> py !xrefsto.py FUNCTION    # xdot call graph
plasma> py !crypto.py              # detect some crypto constants
plasma> py !asm.py CODE            # assemble with keystone
plasma> py !disasm.py HEX_STRING   # disassemble a buffer


Share:

Thursday, July 27, 2017

Search for Code Cave in All Binaries (ELF, PE and Mach-o) and Inject Payload - CAVE MINER


This tools search for code cave in binaries (Elf, Mach-o, Pe), and inject code in them.

Features
  • Find code caves in ELF, PE and Mach-o
  • Use custom bytes for the search (ex: 0xCC can be used as nullbytes on PE)
  • See virtual address of the code cave.
  • See the permissions of the code caves.
  • Search custom cave size
  • Inject the payload into the binary

Dependencies
  • Python2.7
Installation
pip install cave-miner


Exemple


Share:

Saturday, September 3, 2016

A Libre Cross-Platform Disassembler - Panopticon


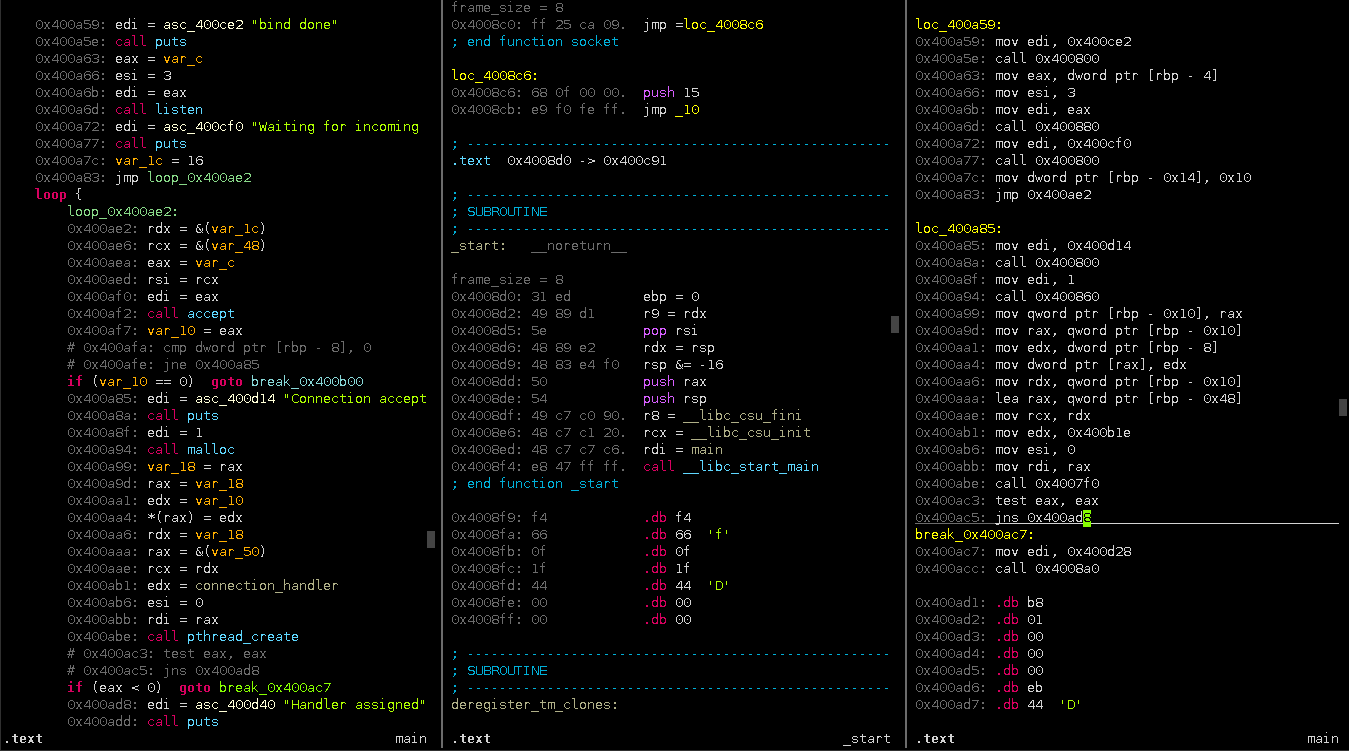
Panopticon is a cross platform disassembler for reverse engineering written in Rust. Panopticon has functions for disassembling, analysing decompiling and patching binaries for various platforms and instruction sets.

Panopticon comes with GUI for browsing control flow graphs, displaying analysis results, controlling debugger instances and editing the on-disk as well as in-memory representation of the program.


Building
Panopticon builds with Rust stable. The only dependencies aside from a working Rust 1.7 toolchain and Cargo you need Qt 5.4 installed.

Linux
Install Qt using your package manager.
Ubuntu 15.10 and 16.04:
sudo apt install qt5-default qtdeclarative5-dev \
qml-module-qtquick-controls qml-module-qttest \
qml-module-qtquick2 qml-module-qtquick-layouts \
qml-module-qtgraphicaleffects \
qtbase5-private-dev pkg-config \
git build-essential cmake
Fedora 22 and 23:
sudo dnf install qt5-qtdeclarative-devel qt5-qtquickcontrols \
qt5-qtgraphicaleffects
After that clone the repository onto disk and use cargo to build everything.
git clone https://github.com/das-labor/panopticon.git
cd panopticon
cargo build
Gentoo:
layman -a rust
layman -f -o https://raw.github.com/das-labor/labor-overlay/master/labor-overlay -a labor-overlay

emerge -av panopticon

Windows
Install the Qt 5.4 SDK and the Rust toolchain Panopticon can be build using  cargo build.

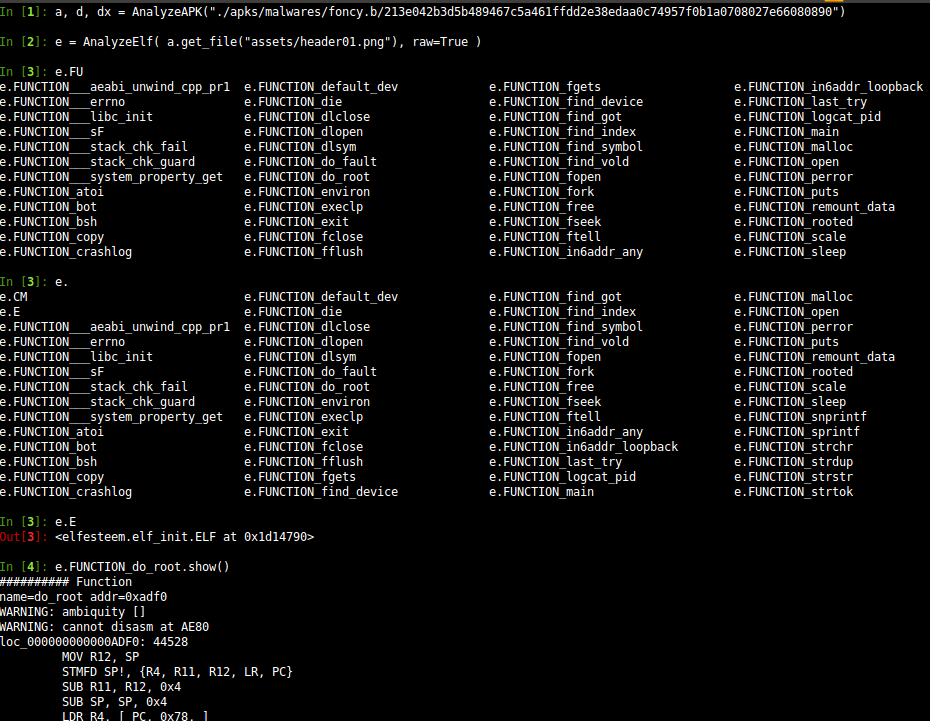
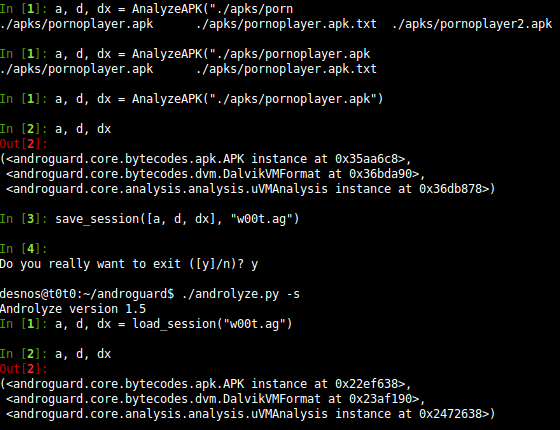
Running
The current version only supports AVR and has no ELF or PE loader yet. To test Panopticon you need relocated AVR code. Such a file is prepared in  tests/data/sosse.

Contributing
Panopticon is licensed under GPLv3 and is Free Software. Hackers are always welcome. See https://panopticon.re for our project documentation. Panopticon uses Github for issue tracking: https://github.com/das-labor/panopticon/issues

Contact
IRC: #panopticon on Freenode. Twitter: @_cibo_


Share:

Sunday, July 24, 2016

Reverse engineering, Malware analysis of Android applications - Androguard


Reverse engineering, Malware and goodware analysis of Android applications ... and more (ninja !)

Features
Androguard is a full python tool to play with Android files.
  •  Map and manipulate DEX/ODEX/APK/AXML/ARSC format into full Python objects, 
  •  Diassemble/Decompilation/Modification of DEX/ODEX/APK format, 
  •  Decompilation with the first native (directly from dalvik bytecodes to java source codes) dalvik decompiler (DAD), 
  •  Access to the static analysis of the code (basic blocks, instructions, permissions (with database from http://www.android-permissions.org/) ...) and create your own static analysis tool, 
  •  Analysis a bunch of android apps, 
  •  Analysis with ipython/Sublime Text Editor, 
  •  Diffing of android applications, 
  •  Measure the efficiency of obfuscators (proguard, ...), 
  •  Determine if your application has been pirated (plagiarism/similarities/rip-off indicator), 
  •  Check if an android application is present in a database (malwares, goodwares ?), 
  •  Open source database of android malware (this opensource database is done on my free time, of course my free time is limited, so if you want to help, you are welcome !), 
  •  Detection of ad/open source librairies (WIP), 
  •  Risk indicator of malicious application, 
  •  Reverse engineering of applications (goodwares, malwares), 
  •  Transform Android's binary xml (like AndroidManifest.xml) into classic xml, 
  •  Visualize your application with gephi (gexf format), or with cytoscape (xgmml format), or PNG/DOT output, 
  •  Integration with external decompilers (JAD+dex2jar/DED/fernflower/jd-gui...) 

1. ScreenShots


Share:

Saturday, April 30, 2016

Multi-Architecture GDB Enhanced Features for Exploiters & Reverse-Engineers - GEF


GEF is aimed to be used mostly by exploiters and reverse-engineers. It provides additional features to GDB using the Python API to assist during the process of dynamic analysis or exploit development.
GEF fully relies on GDB API and other Linux specific source of information (such as /proc/pid ). As a consequence, some of the features might not work on custom or harden systems such as GrSec. It has fully support for Python2 and Python3 indifferently (as more and more distro start pushing gdb compiled with Python3 support).

Quick start

Simply make sure you're having a GDB 7.x+ .

 $ wget -q -O- https://github.com/hugsy/gef/raw/master/gef.sh | sh

Then just start playing (for local files):

$ gdb -q /path/to/my/bin
gef> gef help

Or (for remote debugging)

remote:~ $ gdbserver 0.0.0.0:1234 /path/to/file 

And

local:~ $ gdb -q
gef> gef-remote your.ip.address:1234

Show me

x86


ARM


PowerPC


MIPS


Dependencies

There are none: GEF works out of the box! However, to enjoy all the coolest features, it is recommended to install:
Note : if you are using GDB with Python3 support, you cannot use ROPgadget as Python3 support has not implemented yet. Capstone and radare2-python will work just fine.
Another note : Capstone is packaged for Python 2 and 3 with pip . So a quick install is


$ pip2 install capstone    # for Python2.x
$ pip3 install capstone # for Python3.x

And same goes for ropgadget

$ pip[23] install ropgadget

The assemble command relies on the binary rasm2 provided by radare2 .


Share:

Saturday, February 20, 2016

A Virtual Machine For Assessing Android applications, Reverse Engineering and Malware Analysis - AndroL4b


AndroL4b is an android security virtual machine based on ubuntu Mate includes the collection of latest framework, tutorials and labs from different security geeks and researcher for reverse engineering and malware analysis.


Tools


Share:

Thursday, February 18, 2016

Android Application Analysis - Androguard


Androguard is mainly a tool written in python to play with :

ºDex/Odex (Dalvik virtual machine) (.dex) (disassemble, decompilation),
ºAPK (Android application) (.apk),
ºAndroid’s binary xml (.xml),
ºAndroid Resources (.arsc).


Android Application Analysis

Features:

ºMap and manipulate DEX/ODEX/APK/AXML/ARSC format into full Python objects,
ºDiassemble/Decompilation/Modification of DEX/ODEX/APK format,
ºDecompilation with the first native (directly from dalvik bytecodes to java source codes) dalvik decompiler (DAD),
ºAccess to the static analysis of the code (basic blocks, instructions, permissions (with database from http://www.android-permissions.org/) …) and create your own static analysis tool,
ºAnalysis a bunch of android apps,
ºAnalysis with ipython/Sublime Text Editor,
ºDiffing of android applications,
ºMeasure the efficiency of obfuscators (proguard, …),
ºDetermine if your application has been pirated (plagiarism/similarities/rip-off indicator),
ºCheck if an android application is present in a database (malwares, goodwares ?),
ºOpen source database of android malware (this opensource database is done on my free time, of course my free time is limited, so if you want to help, you are welcome !),
ºDetection of ad/open source librairies (WIP),
ºRisk indicator of malicious application,
ºReverse engineering of applications (goodwares, malwares),
ºTransform Android’s binary xml (like AndroidManifest.xml) into classic xml,
ºVisualize your application with gephi (gexf format), or with cytoscape (xgmml format), or ºPNG/DOT output,
ºIntegration with external decompilers (JAD+dex2jar/DED/…)


Share:

Sunday, February 7, 2016

PE editing - CFF Explorer


The CFF Explorer was designed to make PE editing as easy as possible, but without losing sight on the portable executable's internal structure. This application includes a series of tools which might help not only reverse engineers but also programmers. It offers a multi-file environment and a switchable interface. 


Also, it's the first PE editor with full support for the .NET file format. With this tool you can easily edit metadata's fields and flags. If you're programming something that has to do with .NET metadata, you will need this tool. The resource viewer supports .NET image formats like icons, bitmaps, pngs. You'll be able to analyze .NET files without having to install the .NET framework, this tool has its own functions to access the .NET format. 


Useful links:

- How to write a CFF Explorer Extension 
- CFF Explorer Scripting Language Documentation (v2)
- CFF Explorer Scripting Language Documentation (v1) 
- CFF Explorer Extensions Repository 


Features: 

ºProcess Viewer
ºDrivers Viewer
ºWindows Viewer
ºPE and Memory Dumper
ºFull support for PE32/64
ºSpecial fields description and modification (.NET supported)
ºPE Utilities
ºPE Rebuilder (with Realigner, IT Binder, Reloc Remover, Strong Name Signature Remover, Image Base Changer)
ºView and modification of .NET internal structures
ºResource Editor (full support for Windows Vista icons)
ºSupport in the Resource Editor for .NET resources (dumpable as well)
ºHex Editor
ºImport Adder
ºPE integrity checks
ºExtension support
ºVisual Studio Extensions Wizard
ºPowerful scripting language
ºDependency Walker
ºQuick Disassembler (x86, x64, MSIL)
ºName Unmangler
ºExtension support
ºFile Scanner
ºDirectory Scanner
ºDeep Scan method
ºRecursive Scan method
ºMultiple results
ºReport generation
ºSignatures Manager
ºSignatures Updater
ºSignatures Collisions Checker
ºSignatures Retriever


Share:

API Monitor


Overview

API Monitor is a free software that lets you monitor and control API calls made by applications and services. Its a powerful tool for seeing how applications and services work or for tracking down problems that you have in your own applications.


Features

º 64-bit Support
API Monitor supports monitoring of 64-bit applications and services. The 64-bit version can only be used to monitor 64-bit applications and the 32-bit version can be only be used to monitor 32-bit applications. To monitor a 32-bit application on 64-bit Windows, you must use the 32-bit version. Note that the 64-bit installer for API Monitor includes both 64-bit and 32-bit versions.


ºSummary View with Syntax Highlighting

The Summary window displays information about the API call. This includes the Thread ID and the name of the DLL that made the API call, the syntax-highlighted API call with all parameters and the return value. If the API call fails, information about the error is also displayed.


º13,000+ API Definitions, 1,300+ COM Interfaces

API Monitor comes with API Definitions for over 13,000 API’s from almost 200 DLL’s and over 17,000 methods from 1,300+ COM Interfaces (Shell, Web Browser, DirectShow, DirectSound, DirectX, Direct2D, DirectWrite, Windows Imaging Component, Debugger Engine, MAPI etc). API’s are organized into categories and sub-categories (as specified in MSDN). The API Capture filter enables you to to select API’s for monitoring.


ºStructures, Unions, Enums and Flags

API Monitor can decode and display 2000 different structures and unions, 1000+ Enumerated data types, 800+ flags. Buffers and arrays within structures can also be viewed.


ºBuffer View

API Monitor can display both input and output buffers. The amount of data displayed is automatically calculated from other arguments to the API or from the API return value. The maximum amount of data to be captured is configurable. The following screenshot shows the buffer after a ReadFile API call. The length lpBuffer is calculated by looking at the value of lpNumberOfBytesRead after the API call has executed. In this case, the value returned was 174 and that is the length of the buffer displayed.


ºCall Tree

API Monitor displays a call tree which shows the hierarchy of API calls. The following screenshot displays a call tree for a CoGetClassObject call made by a Visual Basic application that loads the Microsoft Winsock ActiveX control. The ActiveX control MSWINSCK.OCX makes calls to WSAStartup and CreateWindowExA from DllMain.


ºDecode Parameters and Return Values

Both parameters and return values can be displayed in a user-friendly format. The first screenshot below shows the normal view with the parameter values displayed as-is. The second screenshot displays the decoded parameter values. For dwShareMode, API Monitor displays FILE_SHARE_DELETE | FILE_SHARE_READ instead of 5, when the Decode Parameter Values option is enabled. This option is available both in the parameters pane and the summary pane.


ºBreakpoints

API Monitor lets you control the target application by setting breakpoints on API calls. Breakpoints can be triggered before an API call, after an API call, on API failure or if the API generates an exception. Pre-call Breakpoints allow you to modify parameters before they are passed to the API, or to skip the API call and specify the return value and last error code. Post-call and Error Breakpoints allow you to modify parameters, return value and last error code before they are passed back to the caller. Exception Breakpoints allow you to catch the exception to prevent the target application from a possible crash. Global breakpoints can also be triggered on API errors and exceptions. Full Auto-complete support is available for all supported enumerated data types and flags.


ºMonitoring without creating definitions

API Monitor now allows monitoring of any API from any DLL without requiring XML definitions to created. The newly added External DLL Filter allows DLL’s to be added and removed on an as-needed basis. Once a DLL has been added, the filter works exactly the same as the capture filter; individual API’s can be selected for monitoring and breakpoints can be set. In addition, the number of parameters that are captured from these API’s can be specified. The External DLL filter can also be saved to a file allowing multiple set’s of DLL’s to be loaded based on the target application.


ºProcess Memory Editor

API Monitor includes a memory editor that lets you view, edit and allocate memory in any process. The memory editor also allows you to change the protection of memory regions. During a breakpoint, the memory editor can be used to view and modify buffers in the target process. Right-click on any process or service in the Running Process window to launch the memory editor.


ºCall Filtering

API Monitor includes dynamic call filtering capabilities which allows you to hide or show API calls based on a certain criteria. Over 25 different fields can be filtered upon. Filtering can be used, for e.g., to find calls that take more than 50 ms to execute, or to view Unicode API calls that failed and returned error code 2.


ºCOM Monitoring

API Monitor supports monitoring of COM Interfaces. The following screenshot displays COM method calls made by DirectShow GraphEdit.


API Monitor also decodes GUID’s, IID’s and REFIID’s and displays them in a human readable format


ºDecode Error Codes

When an API call fails, API Monitor can call an appropriate error function to retrieve additional information about the error. GetLastError, CommDlgExtendedError, WSAGetLastError functions are supported. In addition, NTSTATUS and HRESULT error codes can be displayed in a friendly format. In the following screenshot, the API connect failed. API Monitor determined the error code by calling WSAGetLastError and displayed both the error code and the error message in red.


ºCall Stack

API Monitor lets you capture and view the call stack for each API call. The following screenshot displays the call stack for a NtCreateFile API.


ºMultiple Layout Options
The GUI in this version has been completely written and provides a number of useful features. A number of pre-defined layout options are available, however, you may choose to create your own custom layout. The GUI is divided into dockable windows for “API Capture Filter”, “Running Processes”, “Output”, “Parameters”, “Hex Buffer”, “Call Stack” and “Hooked Processes”. Each of these windows can be set to “Docking”, “Floating”, “Hide” or “Auto-Hide”.


ºProcess View

The Running Processes window displays a list of running processes and services that can be hooked. You can also right click on any process to launch the memory editor.


ºMonitoring of Services
Monitoring of Windows Services is supported. The following screenshot displays calls made by the Print Spooler service when a document was printed to Microsoft XPS Document Writer. Please note that to enable monitoring of services, your user account must have sufficient privileges (Administrator mode in Vista).


ºCustom DLL Monitoring

API Monitor supports creating definitions for any DLL. Definitions are created in XML format


ºThreads

The Hooked Processes window displays processes that were previously hooked or are currently being monitored. Expanding the process displays all threads for the process. The thread marked with “M” is the main thread of the process. Threads marked with “W” are worker threads. Inactive threads are grayed out and are also marked with a red square in their icon. Each thread displays the Thread ID and start address for the thread.


Share:

Source code editor - Notepad++


What is Notepad++ ?

Notepad++ is a free (free as in both "free speech" and "free beer") source code editor and Notepad replacement that supports several programming languages and natural languages. Running in the MS Windows environment, its use is governed by GPL License.

Features

ºSyntax Highlighting and Syntax Folding
ºPCRE (Perl Compatible Regular Expression) Search/Replace
ºGUI entirely customizable: minimalist, tab with close button, multi-line tab, vertical tab and vertical document list
ºDocument Map
ºAuto-completion: Word completion, Function completion and  Function parameters hint
ºMulti-Document (Tab interface)
ºMulti-View
ºWYSIWYG (Printing)
ºZoom in and zoom out
ºMulti-Language environment supported
ºBookmark
ºMacro recording and playback
ºLaunch with different arguments


Share:

Saturday, February 6, 2016

Advanced Win32 executable file compressor - ASPack (Full)


Obs, Create a virtual machine laboratory to test the software, I am not responsible for damages


ASPack is an advanced Win32 executable file compressor, capable of reducing the file size of 32-bit Windows programs by as much as 70%. (ASPack's compression ratio improves upon the industry-standard zip file format by as much as 10-20%.) ASPack makes Windows 2000/XP/Vista/7/8/10 and Windows Server 2003/2008/2012 programs and libraries smaller, and decrease load times across networks, and download times from the internet; it also protects programs against reverse engineering by non-professional hackers. Programs compressed with ASPack are self-contained and run exactly as before, with no runtime performance penalties.


Share:
Copyright © Offensive Sec Blog | Powered by OffensiveSec
Design by OffSec | Theme by Nasa Records | Distributed By Pirate Edition